PGP In Data Science And Analytics-Job Guarantee Program

Build Your Data Science and Analytics Career with Our 100% Job Guarantee Program

Eligibility: For fresh graduates/Early career professionals with Tech background

6 Months Program with 100% Job Assurance.

Pay 40% of the Fees Now  and 60% of the fees once you get placed .

Guaranteed Interviews
0 +
Projects & Case Studies
0 +
Tools
0 +
Hiring Partner
0 +

2667+

Students Placed

57%

Avg Salary Hike

18+

LPA Highest Salary

21st Sep

Next Cohort

Program Highlights

  • 100+ Hours of Learning from top industry experts.
  • Alumni Connect through webinars and seminars.
  • Access to LMS & Job Portals at PHINCO ELITE.
  • 25+ Real Capstone Projects & Case Studies.
  • 2 Certificates: Internship & Course Completion.
  • Free Alumni Workshops, Webinars, & Seminars.
  • Letter of Recommendation to the companies.
  • Resume Building with ATS Optimization.
  • LinkedIn Profile Enhancement.
  • Interview Question Bank with answers & mock calls.
  • Job Opening Notifications via Email & WhatsApp Community.
  • Dedicated Senior Learning Coordinator for all queries.
  • Dedicated SPOC throughout your career journey.
  • Extra 1-1 Prep Sessions before every interview.
  • Access to Job Portal & HRs for direct applications & communication.
  • Referral Drive with scheduled interviews.
  • Placement Services starting mid-program
  • Daily Academic Support via WhatsApp/Microsoft Teams.
  •  1-1 Mentor Calls available on request.
  •  Dedicated Senior Learning Coordinator for all queries.
  •  Dedicated SPOC throughout your career journey

Who Is This Course For?

Grads/ Post Grads from both IT and Non-IT 

Freshers

Working Professionals

No Prior Knowledge is required

Trusted By Millions Of Learners Around The World

Curriculum

1. Introduction to Data Science and Analysis 📚
  • Overview of Data Science 🌐
  • Key Roles & Responsibilities 🧑‍💼
  • Essential Tools & Technologies 🛠️.
  • Career Path in Data Science Fields 🤑
  • Roles in Data Science Field.
Excel

Module 1: Exploring Data 🔍📊

  • Welcome to Excel: An Overview of the World’s Most Popular Spreadsheet Software 🖥️📈
  • Excel Beyond Limits 🚀📊
  • Mastering the Basics of Spreadsheet Navigation 🧭📋
  • Working on Rows and Columns 📏🔢
  • Looking for Exact Matches 🔍✔️
  • Trimming Function and Its Usage ✂️📉
  • Sorting the Data 🔢🔄
  • Nesting Functions 🏗️🔧
  • Data Types in Excel 📊🔠
  • Type Conversion in Excel 🔄🔢

Module 2: Preparing Data 🛠️📋

  • Mastering Text Functions in Excel: CONCATENATE, UPPER, LOWER, and PROPER ✍️🔤
  • Mastering Text Extraction in Excel: LEFT, RIGHT, and SUBSTITUTE Functions ✂️🔍
  • Mastering Excel’s DATE Function: Effective Techniques for Date Handling 📅🛠️
  • Excel DATEDIF Function (Between Two Dates) 📅↔️📅
  • How To Use Relative & Absolute Cell References in Excel 🔄🔒
  • Harnessing the Power of VLOOKUP for In-depth Insights 🔍🔎
  • Unleashing the Power of SUMIF Function in Excel 🔍➕

Module 3: Analyzing the Data 📈🔍

  • Mastering the COUNT, COUNTA, and COUNTBLANK Functions 🧮🔢📊
  • Unleashing the Power of COUNTIF Function in Excel 📊🔍
  • Using Excel’s Core Calculation Functions: A Practical Guide 📈🛠️
  • Excel Logic Functions Explained: IF, AND, and OR in Practice 🤔🔄
  • Organizing Data with UNIQUE and SORT Functions 🗂️🔄
SQL

Module 1: SQL Fundamentals 📚💻

  • SQL Installation & Setup 🛠️🔧
  • Types of SQL Commands 📜🗂️
  • DDL Commands for Database and Tables 🏗️📋
  • SQL Constraints 🚫📊

Module 2: Data Manipulation with SQL (DML) ✏️🔄

  • Modifying Data in Tables ✍️📋
  • Retrieving Data with SQL 🔍📊

Module 3: Intermediate SQL Queries 🔍📈

  • Selecting Columns 📋🔢
  • Filtering Rows 🔍🗂️
  • Aggregate Functions 📊➕
  • Sorting & Grouping 🔢📊
  • Null Values ❓📉
  • Date and Time Functions 📅⏰
  • Working with Expressions 🧮🔢
  • Order of Execution of SQL Commands 🔄🗂️

Module 4: Joining & Combining Data 🔗🔄

  • Types of Joins 🔍🔗
  • Left & Right Join ⬅️➡️
  • Inner Join and Full Join 🔄🔁
  • Cross Join and Self Join 🔄👤
  • Understanding Table Relationships 🗂️🔗

Module 5: Data Preprocessing & Analysis 🔧📊

  • Handling Missing Values ❓📉
  • Handling Duplicates 🔄🚫
  • Data Transformation 🔄🛠️
  • Working with Dates and Times 📅⏳
  • Data Filtering and Selection 🔍📋
  • Analyzing Time Series Data 📈⏳
  • Performance Optimization ⚡🔧
  • Working with JSON and XML Data 📄🔢
  • Data Blending 🥤🔄

Module 6: Advanced SQL 🚀📊

  • SQL Views 👁️📋
  • Triggers 🚨🔄
  • Performance Tuning ⚙️🚀
  • Backup and Recovery 💾🔄
  • Advanced Joins 🔗🔍
  • Dynamic SQL 🌀🔢
  • Materialized Views 🗂️🔍
  • Database Administration Tasks 🛠️📋

Module 7: Window Functions in SQL 🪟🔢

  • Introduction to Window Functions 📚🪟
  • Analytical Functions 🔍📈
  • Aggregating Data Using Window Functions 📊🔢
  • Partitioning Data and Applying Window Functions 📋🔄
Python

Module 1: Data Preprocessing with Google Play Store 📱🔧

  • Introduction to EDA 📊🔍
  • Data Cleaning 🧹🗃️
  • Data Visualization 📈🎨
  • Data Analysis 🔍📉

Module 2: Advanced Data Preprocessing with Google Play Store 📱🔍

  • Data Preprocessing – Removing Null Value Rows 🚫📋
  • Data Analysis – Numeric 🔢📊
  • Data Analysis – Categorical 🗂️🔍
  • Data Analysis – Automatic Categorical 🤖🗂️
  • Null Values Handling – Numeric 🔢❓
  • Null Values Handling – Categorical 🗂️❓
  • Null Values Handling Overall 🗃️❓

Module 3: Introduction to EDA 📊🔍

  • Introduction to EDA 📚🔎
  • Understanding Your Data 🤔📈

Module 4: Data Cleaning 🧹🔧

  • Dealing with Missing Values ❓🔍
  • Dealing with Duplicate Data 🔄🚫
  • Outliers 🚨📊
  • Outlier Removal Using Z-Score 🔢📉
  • Outlier Removal Using IQR 📏🔄
  • Outlier Removal Using Percentile 📈🔢
  • Correction of Data Type 🔄📊

Module 5: Data Visualization 📊🎨

  • Univariate Analysis (Non-Graphical) 📋🔍
  • Univariate Visualizations (Categorical) 🗂️📈
  • Univariate Visualizations (Numerical) 🔢📉
  • Bivariate Analysis (Numerical-Categorical) 🔢🗂️
  • Bivariate Visualizations (Categorical) 🗂️🔍
  • Bivariate Visualization (Numerical) 🔢🔍

Module 6: Data Analysis 🔍📊

  • Data Analysis with Multiple Columns 📊🔢
  • Data Analysis Using Conditions 🔄🔍
  • GroupBy in Pandas 📊🔗
Power BI

Introduction to PowerBI 📊🔍

  • Overview of PowerBI 🌐🖥️
  • PowerBI Interface Tour 🖱️📋
  • PowerBI Desktop vs. PowerBI Service 💻☁️
  • Connecting to Data Sources 🔗📊
  • Creating Your First Report 📝📊

Understanding the Parameters ⚙️📋

  • What Are Parameters? ❓🔍
  • Creating Parameters ✍️🔧
  • Using Parameters in Queries 🔄📈
  • Parameter Controls and Their Use 📊🎛️
  • Dynamic Parameter Values 🔄📉

Fundamentals of PowerBI 📚💡

  • Data Import and Transformation 🔄📥
  • Data Modeling Basics 📊🔗
  • Building and Managing Relationships 🔗🗂️
  • Introduction to DAX (Data Analysis Expressions) 🔢📏
  • Creating Basic Visualizations 📉🔧
Streamlit

Module 1: Getting Started with Streamlit 🚀🖥️

  • Introduction to Streamlit 📚🔍
  • Streamlit Setup 🛠️📥
  • Basic Output Tags 🏷️📝
  • Inspecting the Website 🔍🌐
  • Text Input 📝🔠
  • Special Input with Buttons 🔘✨
  • Forms 📝📋
  • Integrating Scripts 🔗📜

Module 2: Page Beautification 🎨🖼️

  • Working with Columns 📊🗂️
  • Working with Tabs 📑🔄
  • Expander & Empty Functionalities 🔽📂
  • Advanced Display & Progress Options 📈🔧
  • Echo and Stop Commands 🔄⏹️

Module 3: Working with Data 📊🔗

  • Working with Media Files 🎥📁
  • DataFrames with Streamlit 🗃️📊
  • File Uploading ⬆️📂
  • Image Converter 🖼️🔄
  • Image Rotation 🔄🖼️

Module 4: Introduction to Data Visualization 📈🔍

  • Getting Started with Basic Plots with Streamlit 📊🔧
  • Plots with Matplotlib and Seaborn 📉🎨
  • Visualization with Plotly 📊🔍

Module 5: Deployment 🚀🌐

  • Deployment on Streamlit Server 🌐🖥️
Statistics

Introduction to Statistics 📊🔍

  • What is Statistics? ❓📚
  • Importance of Statistics 📈🔍
  • Applications of Statistics 🏥📉
  • Statistical Methods Overview 📋🛠️

Data and Their Types 📊🔢

  • Types of Data 🗃️🔠
    • Quantitative Data 🔢📏
    • Qualitative Data 🗂️🔡
  • Levels of Measurement 🎚️🔢
    • Nominal 🏷️
    • Ordinal 📈
    • Interval 📅
    • Ratio 🔢📏

Introduction to Descriptive Stats 📊📋

  • What is Descriptive Statistics? 📈🔍
  • Purpose of Descriptive Stats 🎯🔍
  • Types of Descriptive Statistics 📊🔢

Measures of Frequency 📊🔢

  • Frequency Distribution 📉📋
  • Frequency Tables 📊🗂️
  • Histograms 📈🔢
  • Frequency Polygons 📉🔗

Measures of Central Tendency 🧮📈

  • Mean ➗🔢
  • Median 📍🔢
  • Mode 🔁🔢
  • Comparing Measures of Central Tendency 🔄📈

Measures of Dispersion 📏📊

  • Range 🏆🔢
  • Variance 📈🔢
  • Standard Deviation 📊🔢
  • Interquartile Range (IQR) 📉🔢

Measures of Shape 📏📊

  • Skewness 🏞️🔢
  • Kurtosis 🏔️🔢
  • Symmetry of Distribution 🔄📈
Specializations
  • Machine Learning Introduction 🤖📚
  • Machine Learning Advanced 🚀📊
  • Introduction to AI and Deep Learning 🤖🔍
  • Natural Language Processing 🗣️🔍
  • Generative AI 🧠🎨
  • ChatGPT 🗨️🤖

6 Months

120+ Learning Hours

10+ Tools

5+ Assured Interviews
Have questions? Contact us

What Projects I will learn ?

Tools & Technologies

Learning Journey

Our Data Science Post Graduation program is offered online, as well as through self paced.

What are the roles ?

After completing PHINCO ELITE’s digital marketing course, here are various roles in digital marketing

Data Scientist

Data Analyst

Business Intelligence Analyst 

Statistician

Data Consultant

Data Engineer

Quantitative Analyst

Data Architect

See Yourself In One Of These Roles?

Become A Data Science Expert

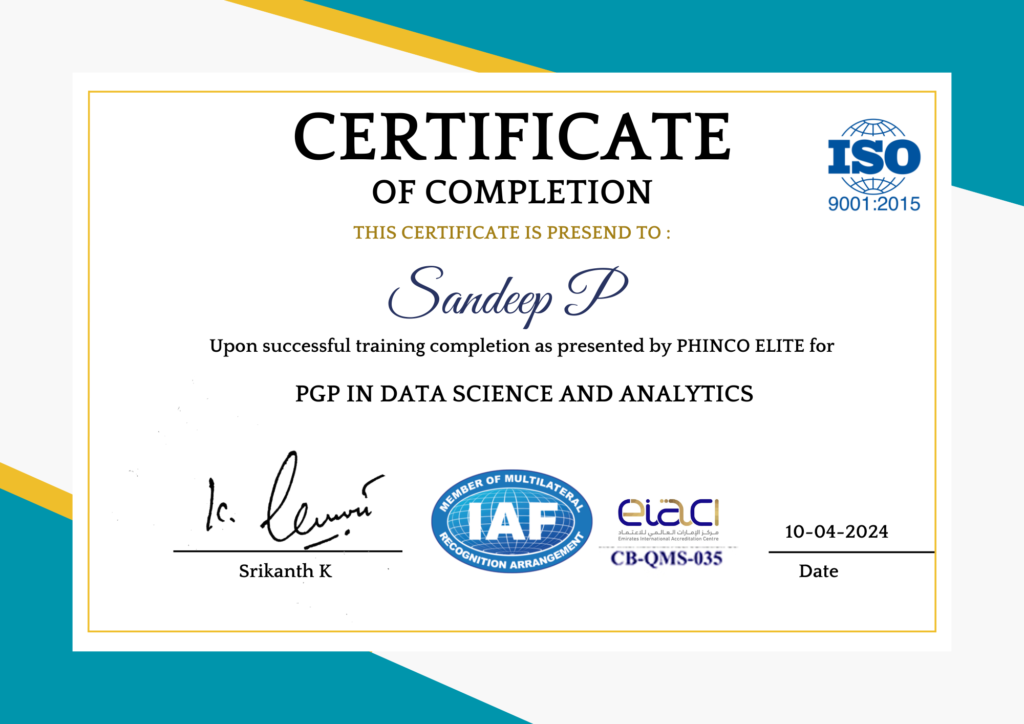
Upon successfully completing this program, you’ll earn a course complettion certificate along with Letter of Recommendation and Internship Certificate with global validitity.

Earn Your
Certificate

Achieve Your
Goals

Admission Process

Call Back Request

Attend Demo Call

Scholarship Test

Admission Letter

Take Admission

Start your Journey in
Data Science Domain

 ₹2,99,999

 ₹1,99,999

Pay 40% of the Fees Now  and 60% of the fees once you get placed 

Fee Amount
Program Fee
₹ 1,99,999
Pay 40% of the Fees Now
₹ 79,999
Pay 60% of Fees,after getting job
₹ 1,20,000
EMI options
3/6/9/12/24/36 Months of EMI

Up skill with PHINCO ELITE

Our goal is to provide you with a comprehensive educational experience. We continue to support you when you enter the workforce with a fresh outlook thanks to our unique career support services. Gain entry to more than 100 hiring partners and discover countless opportunities.

Resume Building

Interview Question Bank

LinkedIn Enhancement

Mock Calls

5+ Assured Interviews

Our Alumni Work At

Build Your Success Story With PHINCO ELITE

Rajat Gupta

PHINCO Elite's Digital Marketing Specialist program has been instrumental in defining my career path. Completing the course allowed me to establish

Shikha Agarwal

I enrolled in the Digital Marketing Specialist course from PHINCO Elite. After completing the course, I could find a job at a digital marketing agency.

Ankur Sharma

Fantastic class and faculty was outstanding and helpful. The course curriculum is designed thoughtfully. If you want to change your career

Swati Bansal

PHINCO Elite provides the ideal platform to learn Digital Marketing. I would recommend PHINCO to anyone looking to do a Digital Marketing course.

Riya Rathi

Fantastic class and faculty was outstanding and helpful. The course curriculum is designed thoughtfully. If you want to change your career

FAQs

What are the prerequisites for pursuing this course?

Any one from any educational background with Zero knowledge can do this program

10+2/Diploma/Graduation/PG/Freshers/Career Gaps/Homemakers/Freelancers can enrol

What is the average salary of a Data Science Associate?

The estimated total pay for a Data Science Associate is ₹8,00,000 per year, with an average salary of ₹5,00,000 per year. This number represents the median, which is the midpoint of the ranges from our proprietary Total Pay Estimate model and based on salaries collected from our users. The estimated additional pay is ₹3,00,000 per year. Additional pay could include cash bonus, commission, tips, and profit sharing.

Which industries hire Data Science Professionals the Most?

Every industry need Data Science teams to understand their products and services .Industries include Education, retail, finance, entertainment, government and public sector, higher education, sharing economy services, sales & marketing, agriculture, business intelligence, healthcare, and Banking,Media etc.,

How can i resolve my doubts while learning

We have a team called students mentors team who will be with you from the day of your joining to till you complete the program.You can reach them through our Portal SLACK

How can I get Career Support After course Completion?

Career Services Team will help you with Resume Building,Mock Calls,Interview Question Bank and we will also a Provide Access to our job Portal PHINCO ELITE JOBS where you can access unlimited Job openings

I have no tech skills.Will it work for me?

We teach from scratch. So we will cover everything from Basics to Advanced Concepts with Hands-on Experience.

Our Students Work At

..... ..... .....
..... ..... .....
...... ......