Data Science & Analytics with Gen AI Training

4 months live structured program designed by industry experts to upskill & successfully transition to Data Science roles.
  • Navigate Your Career with 20+ Data Science Job Options.


  • Eligibility:  Any Graduate/Post Graduate with Min 50%.


  • No Coding Knowledge is required.

Unlock Your Career in 20+ Domains and 20+ Roles in Data Science in Hyderabad

Within 4 Months ,Just by Learning 10+ Tools and 10+ Real Capstone Projects.

Simulation Based Learning

It refers to an educational approach that uses realistic, immersive simulations to teach skills, concepts, and problem-solving strategies in a controlled environment.

Real Capstone Projects

10 + Real Capstone Projects with real Data Sets from top MNC's Experts from companies like FAANG and Top MNC's like Google and Microsoft.

Job Referral Program

Access to 300+ Job Openings ,10 + Job Referrals with collaboration of 350+ Hiring Partners and consultancies.

Book a Free Session

Talk to the Career Specialist Now

Schedule a Free Career Counselling Session Now.

About

Technology fueled by User Experience

Navigate Your Career with 40+ Data Science Job Options in multiple Domains and Various Roles Pan India

0

Happy Students

0 L

Highest CTC

0

Hiring Partners

Program Highlights

  • 100+ Hours of Learning from top industry experts.
  • Alumni Connect through webinars and seminars.
  • Access to LMS & Job Portals at PHINCO ELITE.
  • 10+ Real Capstone Projects & Case Studies.
  • 10 Certificates: Technology,Experience & Course Completion.
  • Free Alumni Workshops, Webinars, & Seminars.
  • Letter of Recommendation to the companies.
  • Resume Building with ATS Optimization.
  • LinkedIn Profile Enhancement.
  • Interview Question Bank with answers & mock calls.
  • Job Opening Notifications via Email & WhatsApp Community.
  • Dedicated Senior Learning Coordinator for all queries.
  • Dedicated SPOC throughout your career journey.
  • Extra 1-1 Prep Sessions before every interview.
  • Access to Job Portal & HRs for direct applications & communication.
  • Referral Drive with scheduled interviews.
  • Placement Services starting mid-program
  • Daily Academic Support via WhatsApp/Microsoft Teams.
  •  1-1 Mentor Calls available on request.
  •  Dedicated Senior Learning Coordinator for all queries.
  •  Dedicated SPOC throughout your career journey

Who can Enroll?

Any Grad/PG with <50%

Freshers with Zero Experience

Non IT -IT Job Change

Career Gap

Trusted By Millions Of Learners Around The World

Curriculum

Data Science Career Accelerator Program with AI
  • Overview of Full Stack Data Science with AI 🌐
  • Key Roles & Responsibilities 
  • Essential Tools & Technologies
  • Career Path in Data Science Fields 🤑
  • Roles in Data Science Field.
Excel with AI

Module 1: Exploring Data with AI🔍📊

  • Welcome to Excel: An Overview of the World’s Most Popular Spreadsheet Software 🖥️📈
  • Excel Beyond Limits 🚀📊
  • Mastering the Basics of Spreadsheet Navigation 🧭📋
  • Working on Rows and Columns 📏🔢
  • Looking for Exact Matches 🔍✔️
  • Trimming Function and Its Usage ✂️📉
  • Sorting the Data 🔢🔄
  • Nesting Functions 🏗️🔧
  • Data Types in Excel 📊🔠
  • Type Conversion in Excel 🔄🔢

Module 2: Preparing Data with AI🛠️📋

  • Mastering Text Functions in Excel: CONCATENATE, UPPER, LOWER, and PROPER ✍️🔤
  • Mastering Text Extraction in Excel: LEFT, RIGHT, and SUBSTITUTE Functions ✂️🔍
  • Mastering Excel’s DATE Function: Effective Techniques for Date Handling 📅🛠️
  • Excel DATEDIF Function (Between Two Dates) 📅↔️📅
  • How To Use Relative & Absolute Cell References in Excel 🔄🔒
  • Harnessing the Power of VLOOKUP for In-depth Insights 🔍🔎
  • Unleashing the Power of SUMIF Function in Excel 🔍➕

Module 3: Analyzing the Data with AI📈🔍

  • Mastering the COUNT, COUNTA, and COUNTBLANK Functions 🧮🔢📊
  • Unleashing the Power of COUNTIF Function in Excel 📊🔍
  • Using Excel’s Core Calculation Functions: A Practical Guide 📈🛠️
  • Excel Logic Functions Explained: IF, AND, and OR in Practice 🤔🔄
  • Organizing Data with UNIQUE and SORT Functions 🗂️🔄
SQL with AI

Module 1: SQL Fundamentals 📚💻

  • SQL Installation & Setup 🛠️🔧
  • Types of SQL Commands 📜🗂️
  • DDL Commands for Database and Tables 🏗️📋
  • SQL Constraints 🚫📊

Module 2: Data Manipulation with SQL (DML) ✏️🔄

  • Modifying Data in Tables ✍️📋
  • Retrieving Data with SQL 🔍📊

Module 3: Intermediate SQL Queries 🔍📈

  • Selecting Columns 📋🔢
  • Filtering Rows 🔍🗂️
  • Aggregate Functions 📊➕
  • Sorting & Grouping 🔢📊
  • Null Values ❓📉
  • Date and Time Functions 📅⏰
  • Working with Expressions 🧮🔢
  • Order of Execution of SQL Commands 🔄🗂️

Module 4: Joining & Combining Data 🔗🔄

  • Types of Joins 🔍🔗
  • Left & Right Join ⬅️➡️
  • Inner Join and Full Join 🔄🔁
  • Cross Join and Self Join 🔄👤
  • Understanding Table Relationships 🗂️🔗

Module 5: Data Preprocessing & Analysis 🔧📊

  • Handling Missing Values ❓📉
  • Handling Duplicates 🔄🚫
  • Data Transformation 🔄🛠️
  • Working with Dates and Times 📅⏳
  • Data Filtering and Selection 🔍📋
  • Analyzing Time Series Data 📈⏳
  • Performance Optimization ⚡🔧
  • Working with JSON and XML Data 📄🔢
  • Data Blending 🥤🔄

Module 6: Advanced SQL 🚀📊

  • SQL Views 👁️📋
  • Triggers 🚨🔄
  • Performance Tuning ⚙️🚀
  • Backup and Recovery 💾🔄
  • Advanced Joins 🔗🔍
  • Dynamic SQL 🌀🔢
  • Materialized Views 🗂️🔍
  • Database Administration Tasks 🛠️📋

Module 7: Window Functions in SQL 🪟🔢

  • Introduction to Window Functions 📚🪟
  • Analytical Functions 🔍📈
  • Aggregating Data Using Window Functions 📊🔢
  • Partitioning Data and Applying Window Functions 📋🔄
Python with AI

Module 1: Data Preprocessing with Google Play Store 📱🔧

  • Introduction to EDA 📊🔍
  • Data Cleaning 🧹🗃️
  • Data Visualization 📈🎨
  • Data Analysis 🔍📉

Module 2: Advanced Data Preprocessing with Google Play Store 📱🔍

  • Data Preprocessing – Removing Null Value Rows 🚫📋
  • Data Analysis – Numeric 🔢📊
  • Data Analysis – Categorical 🗂️🔍
  • Data Analysis – Automatic Categorical 🤖🗂️
  • Null Values Handling – Numeric 🔢❓
  • Null Values Handling – Categorical 🗂️❓
  • Null Values Handling Overall 🗃️❓

Module 3: Introduction to EDA 📊🔍

  • Introduction to EDA 📚🔎
  • Understanding Your Data 🤔📈

Module 4: Data Cleaning 🧹🔧

  • Dealing with Missing Values ❓🔍
  • Dealing with Duplicate Data 🔄🚫
  • Outliers 🚨📊
  • Outlier Removal Using Z-Score 🔢📉
  • Outlier Removal Using IQR 📏🔄
  • Outlier Removal Using Percentile 📈🔢
  • Correction of Data Type 🔄📊

Module 5: Data Visualization 📊🎨

  • Univariate Analysis (Non-Graphical) 📋🔍
  • Univariate Visualizations (Categorical) 🗂️📈
  • Univariate Visualizations (Numerical) 🔢📉
  • Bivariate Analysis (Numerical-Categorical) 🔢🗂️
  • Bivariate Visualizations (Categorical) 🗂️🔍
  • Bivariate Visualization (Numerical) 🔢🔍

Module 6: Data Analysis 🔍📊

  • Data Analysis with Multiple Columns 📊🔢
  • Data Analysis Using Conditions 🔄🔍
  • GroupBy in Pandas 📊🔗
Power BI with AI

📘 Section 1: Power BI – Introduction & Setup

  • 🧠 What is Business Intelligence?
  • 📊 What is Power BI and Why Power BI in Data Analysis
  • 🛠️ Power BI Components
  • Practical Applications
  • ⬇️ Downloading Power BI & Adjusting Settings
  • 👍 Advantages of Power BI, 👎 Disadvantages of Power BI
  • 🔌 Types of Data Connectors in Power BI Desktop
  • 🔄 Differences Between Microsoft Power BI and SSRS
  • 💰 Power BI Free vs Power BI Pro vs Power BI Premium

📐 Section 2: Power BI – Query Editor

  • ✏️ Edit Power BI App
  • 🔄 Query Editor in Power BI for Data Transformation
  • 🔢 Working with Numbers in Power BI
  • 🕒 Working with Date & Time Tools
  • 📆 Creating a Rolling Calendar in Power BI
  • 🎛️ Conditional Columns in Power BI
  • 📚 Grouping & Aggregating Records
  • 🔗 Merge and Append Queries in Power BI
  • 🔒 Manage Data Source Settings and Permissions
  • 🔄 Data Refresh in Power BI
  • 🏷️ Power BI Data Types
  • 🌲 Explain Power BI Hierarchy, and How to Use it
  • 🔗 Power BI – Excel Integration

📊 Section 3: Power BI Dashboard and Visualization

  • 🖥️ Power BI – Dashboard
  • 🎯 Power BI – Dashboard Actions
  • 🎨 Adding Objects to the Power BI Report Canvas and Exploring the “Report” View
  • 🔗 Creating Table Relationships & Data Models in Power BI
  • 📈 Inserting Basic Charts & Visuals in Power BI
  • 🎨 Conditional Formatting
  • 📊 How to Add Reports to Dashboards
  • 🎛️ Power BI Report Formatting Options
  • 🔍 Power BI Report Filtering Options
  • 📋 Exploring Data with Matrix Visuals
  • 📅 Filtering with Date Slicers
  • 📈 Adding Trend Lines & Forecasts
  • ✏️ Editing Power BI Report Interactions
  • 🔍 Adding Drillthrough Filters
  • 📝 Inserting Text Cards
  • 🖌️ How to Format a Card?
  • 📋 Format Multi-Row Card
  • 🗺️ Visualizing Geospatial Data with Maps
  • 🎨 How to Format Maps
  • 🌳 Visualizing Data with Treemaps
  • 🎨 Format Tree Map
  • 👥 Managing & Viewing Roles in Power BI Desktop
  • 📋 Creating a Simple Table
  • 🎨 Power BI – Format Table Chart
  • 📊 Create a Stacked Column Chart
  • 🎨 Power BI – Format Stacked Column Chart
  • 📊 Create a 100% Stacked Column Chart
  • 🎨 Format 100% Stacked Bar Chart
  • 📊 Create a Stacked Bar Chart
  • 🎨 Power BI – Format Stacked Bar Chart
  • 📈 How to Create a Stacked Area Chart
  • 🎨 Power BI – Format Area Chart
  • 🧭 Create a Radial Gauge Chart
  • Create Key Performance Indicators (KPIs) Chart
  • 🎨 Power BI – Format KPIs Chart
  • 📊 Format Clustered Bar Chart
  • 🎨 Power BI – Format Clustered Bar Chart
  • 🌊 How to Create a Waterfall Chart?
  • 🎨 Format Waterfall Chart
  • 🗺️ Create a Filled Map
  • 🎨 Format Filled Map
  • 📈 Create a Scatter Chart
  • 🎨 Format Scatter Chart
  • 📉 Showing Trends with Line Charts
  • 🎨 Power BI – Format Line Chart
  • 🗺️ How to Create a Shape Map?
  • 🍩 Format Donut Chart
  • 🥧 Format Pie Chart
  • 🎀 Format Ribbon Chart
  • 🔣 Create an R Script Visual
  • 📊 Line and Stacked Column Chart
  • 🎨 Format Line and Clustered Column Chart

🧮 Section 4: DAX Introduction

  • 📊 Data Analysis Expressions (DAX)
  • ✏️ Intro to DAX Calculated Columns
  • 🔢 Creating Measures Using DAX
  • Adding Columns & DAX Measures in Power BI Desktop
  • 🔍 Filter Context in Power BI
  • 📚 Common DAX Function Categories
  • 🕒 Basic Date & Time Functions
  • 🔄 DAX Window Function
  • 🔀 Conditional & Logical Functions
  • 🏷️ DAX Information Functions
  • 📝 DAX Text Functions
  • 🔢 Index Function in Power BI
  • DAX Trigonometric Functions
  • 📅 DAX COUPDAY Financial Function
  • 💰 DAX Depreciation Functions
  • 🧮 Power BI – Distinct() Function
  • Basic Math in Power BI
  • 🔢 Power BI – DAX Trigonometric Functions
  • 🔢 COUNT Functions
  • 📅 Power BI – DAX Date Functions
  • 📊 DAX Aggregate Functions in Power BI
  • 📝 Power BI – DAX TEXT Functions
  • 💰 Power BI – DAX Depreciation Functions
  • 🔣 Power BI – DAX Bitwise Functions

🔗 Section 5: Creating Table Relationships & Data Models in Power BI

  • 📋 What is a “Data Model”?
  • 📚 Principles of Database Normalization
  • 📄 Understanding Data Tables vs. Lookup Tables
  • 🔗 Understanding Table Relationships vs. Merged Tables
  • 🔄 Creating Table Relationships in Power BI Desktop
  • ✏️ Managing & Editing Table Relationships | Power BI
  • 🔄 Managing Active vs. Inactive Relationships | Power BI
  • 🔗 Connecting Multiple Data Tables in Power BI
  • 🔍 Understanding Filters in Power BI
  • 🔒 Hiding Tables, Columns, and Fields from Power Pivot
Streamlit with AI

Module 1: Getting Started with Streamlit 🚀🖥️

  • Introduction to Streamlit 📚🔍
  • Streamlit Setup 🛠️📥
  • Basic Output Tags 🏷️📝
  • Inspecting the Website 🔍🌐
  • Text Input 📝🔠
  • Special Input with Buttons 🔘✨
  • Forms 📝📋
  • Integrating Scripts 🔗📜

Module 2: Page Beautification 🎨🖼️

  • Working with Columns 📊🗂️
  • Working with Tabs 📑🔄
  • Expander & Empty Functionalities 🔽📂
  • Advanced Display & Progress Options 📈🔧
  • Echo and Stop Commands 🔄⏹️

Module 3: Working with Data 📊🔗

  • Working with Media Files 🎥📁
  • DataFrames with Streamlit 🗃️📊
  • File Uploading ⬆️📂
  • Image Converter 🖼️🔄
  • Image Rotation 🔄🖼️

Module 4: Introduction to Data Visualization 📈🔍

  • Getting Started with Basic Plots with Streamlit 📊🔧
  • Plots with Matplotlib and Seaborn 📉🎨
  • Visualization with Plotly 📊🔍

Module 5: Deployment 🚀🌐

  • Deployment on Streamlit Server 🌐🖥️
Statistics

Introduction to Statistics 📊🔍

  • What is Statistics? ❓📚
  • Importance of Statistics 📈🔍
  • Applications of Statistics 🏥📉
  • Statistical Methods Overview 📋🛠️

Data and Their Types 📊🔢

  • Types of Data 🗃️🔠
    • Quantitative Data 🔢📏
    • Qualitative Data 🗂️🔡
  • Levels of Measurement 🎚️🔢
    • Nominal 🏷️
    • Ordinal 📈
    • Interval 📅
    • Ratio 🔢📏

Introduction to Descriptive Stats 📊📋

  • What is Descriptive Statistics? 📈🔍
  • Purpose of Descriptive Stats 🎯🔍
  • Types of Descriptive Statistics 📊🔢

Measures of Frequency 📊🔢

  • Frequency Distribution 📉📋
  • Frequency Tables 📊🗂️
  • Histograms 📈🔢
  • Frequency Polygons 📉🔗

Measures of Central Tendency 🧮📈

  • Mean ➗🔢
  • Median 📍🔢
  • Mode 🔁🔢
  • Comparing Measures of Central Tendency 🔄📈

Measures of Dispersion 📏📊

  • Range 🏆🔢
  • Variance 📈🔢
  • Standard Deviation 📊🔢
  • Interquartile Range (IQR) 📉🔢

Measures of Shape 📏📊

  • Skewness 🏞️🔢
  • Kurtosis 🏔️🔢
  • Symmetry of Distribution 🔄📈
Machine Learning Introduction
  • What is AI.
  • What is Machine Learning?.
  • Understanding Data and Terminology.
  • Types of Learning
    Regression vs Classification.
  • Subset Of AI
Introduction to AI and Deep Learning
  • Introduction – Neurons vs Artificial Neural Networks.
  • Learning of ANN.
  • How to Implement and Visualize a Perceptron in Artificial Neural Networks?

4 Months

100+ Learning Hours

10+ Tools

300+ Job Openings

Real Capstone Projects

*Changes According to the Market and Time lines*

Customer Churn Analysis Tata Consultancy Services

Analyzed customer behavior to predict churn, enabling proactive retention strategies for telecom operator

Sales Forecasting Infosys

Developed predictive models to forecast sales trends and optimize inventory management.

Fraud Detection in Banking Wipro

Identified fraudulent transactions using anomaly detection techniques.

Customer Sentiment Analysis Cognizant

Leveraged natural language processing (NLP) to analyze customer reviews and improve product recommendations.

HR Attribution Analysis Accenture

Analyzed employee turnover trends and identified factors leading to attrition.

Healthcare Patient Data Analysis HCL Technologies

Evaluated patient demographics and medical history to enhance patient care and resource allocation

Energy Consumption Optimization Tech Mahindra

Monitored and optimized energy usage patterns for industrial clients.

Logistics Route Optimization Capgemini

Optimized delivery routes to minimize costs and improve efficiency.

Insurance Claim Analysis IBM India

Analyzed claims data to detect fraudulent claims and streamline processing.

Market Basket Analysis Amazon

Used association rule mining to identify product bundling opportunities.

Tools & Technologies

Roles that you can enter Post Completion of Training

Our Data Analyst Career Accelerator Program with AI is designed to transform aspiring professionals into industry-ready Data Analysts. Combining the fundamentals of data analytics with cutting-edge AI tools, this program equips you with the skills to thrive in a data-driven world while unlocking your career in 40+ different verticals across diverse industries.


Become A Data Science Expert

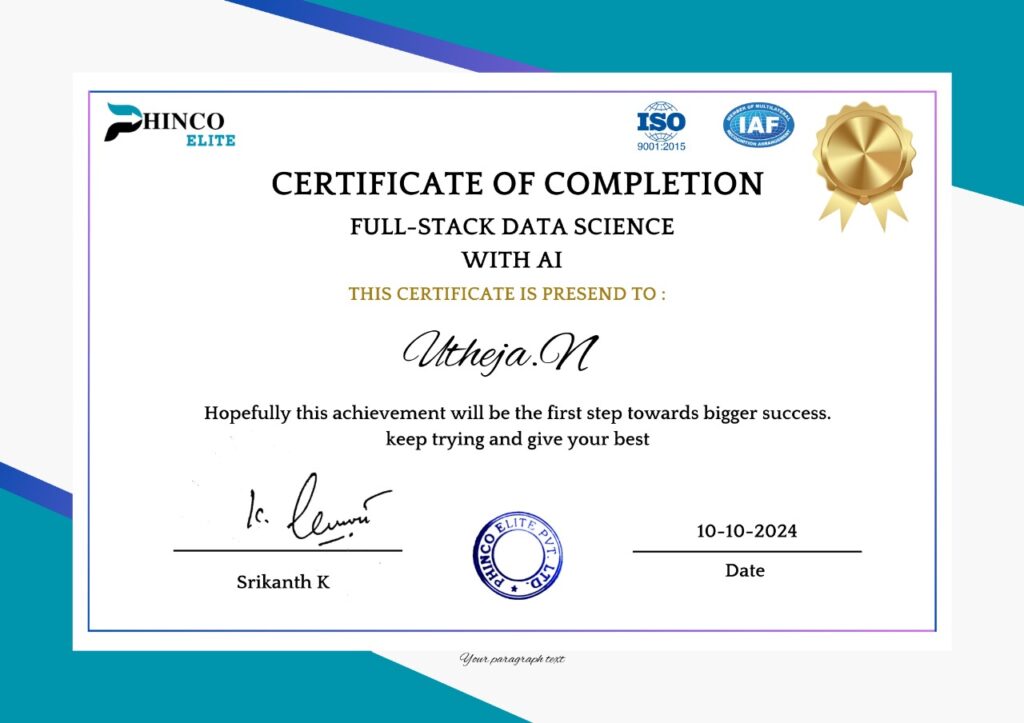
Upon successfully completing this program, you’ll earn a course complettion certificate along with Letter of Recommendation and Internship Certificate with global validitity.

Earn Your
Certificate

Achieve Your
Goals

Admission Process

Call Back Request

Attend Demo Call

Submit Your Resume

Take Admission

Up skill with PHINCO ELITE


Our goal is to provide you with a comprehensive educational experience. We continue to support you when you enter the workforce with a fresh outlook thanks to our unique career support services. Gain entry to more than 352+ hiring partners and discover countless opportunities.

Resume Building

Interview Question Bank

2 Years of Placement Support

LinkedIn Enhancement

Mock Calls

300+ Job Openings

Our Amazing Hiring Partners

Who can Enroll

  • Any Graduates with Minimum of 50% in Academics.
  • Good Communication Skills.
  • Freshers from any Graduation Discipline.
  • Non IT Professionals with any experience age less than 38 Years.
  • Career Gap upto 10 Years.
  • House Wives/Career Restarters with less than 10 Years Gap
Freshers
0%
Non IT to IT Professionals
0%
Career Gap
0%
House Wives/Career Re-starters
0%
Career

Bring Innovation to Your Career

Let’s start the journey towards success and enhance revenue for your business. Take your company to the next level.

Data Science Training

  • 100 + Hours of Learning
  • 45000 Worth of Interview Prep Course (Free)}
  • 70000 Worth of Real Data Sets to Practice(Free)
  • 25000 Worth of Cracked Version Tools(Free)
  • 15000 Worth of Recorded Videos( Free)
  • 45000 Worth of Job Portal Access ( Free)
  • 70000 Worth of Placement Support
  • Total Worth of 2,70,000 Included in this

Data Science Pro Training

  • Life time Access to Recordings
  • Life time Access to Job Portal
  • Life time Access to Tools
  • Life time Access to Interview Prep Course
  • Access to Premium Job Openings -Upto 36 LPA
  • Access to Unlimited Job Referrals until you get placed
  • Total Worth of 395000 included in this
 

Submit Your Resume Now

Please share your resume so that  my placements team will  share Placement Eligibility Report of yours.
 
📊 Placement Eligibility Report: I will assist you with a detailed report covering:  
✅ Eligibility: Your placement eligibility status.  
🌍 Locations: The locations you're eligible for.  
💼 Roles: Suitable roles available.  
💸 Discounted Price: Special discounts you can avail.


Frequently Asked
Questions

Welcome to our FAQ section! Here, we’ve compiled answers to the most common questions we receive from our users. Whether you're looking for help with our trainings, you’ll find quick and helpful information here. If your question isn’t covered, feel free to reach out to our support team – we’re here to assist!


  • Any Graduate with 50%.
  • House Wives up to 10 Years Gap.
  • Non IT Working Professionals.
  • Career Gap without any Prior Experience.
  • Weekend Online Live Classes
  • Doubt resolutions on Wednesday and Thursday.
  • Live Time Access to the Recorded Sessions 
  • Education.
  • Retail.
  • Finance.
  • Information Technology(IT)
  • Entertainment.
  • Government and public sector.
  • Health Care.
  • BFSI.
  • Automobile & Manufacturing.
  • Hospitality & Tourism.
  • Telecommunications.
  • Data Analyst
  • Business Analyst 
  • HR Analyst
  • Operations Analyst
  • Finance Analyst
  • Marketing Analyst 
  • Product Analyst
  • Risk Analyst
  • Supply Chain Analyst
  • Health Care Data Analyst 
  • Fraud Analyst
  • Data Scientist
  • Resume Building.
  • LinkedIn Enhancement.
  • Mock Interviews.
  • 2 Years of Placement Support.
  • Interview Question Bank.
  • Access to our job Portal PHINCO ELITE JOBS
 

Student Testimonials

..... ..... .....
..... ..... .....
...... ......